Metrics tell you something is slow. Logs tell you an error occurred. Neither tells you why a request that touched six services took three seconds when it should have taken two hundred milliseconds. That is the problem distributed tracing solves, and Tempo is how I added it to the stack.
I resisted tracing for a while. It felt like the kind of thing big companies with dozens of microservices needed, not something relevant for the systems I was building. I was wrong. Even with three or four services talking to each other, tracing answers questions that metrics and logs simply cannot.
What Tracing Actually Shows You
Every request that comes into your system gets assigned a trace ID. As that request flows through your services, each operation — a database query, an HTTP call to another service, a cache lookup — becomes a span within that trace. At the end, you have a complete picture of everything that happened, in order, with timing for each step.
The first time I looked at a real trace for a slow request, I found the problem in about thirty seconds. One database query that should have used an index was doing a full table scan. It showed up as a span taking 1.8 seconds in a request that was otherwise fine. Without tracing I would have been adding log statements and redeploying, hoping to catch it again.
Tempo's Place in the Stack
Tempo is Grafana's distributed tracing backend. Like Loki with logs, it is designed to be cheap to run and simple to operate. It stores traces in object storage — S3, Azure Blob, or local disk — and indexes only the trace ID and a handful of metadata fields. You do not pay for full-text indexing of every span attribute.
It accepts traces in the standard formats: OpenTelemetry, Jaeger, Zipkin. You pick what your application emits and Tempo receives it. No proprietary protocol.
And like Prometheus and Loki before it, it connects directly to Grafana. Once it is wired up, you can jump from a spike in your error rate panel straight to the traces from that time window. From there you drill into individual spans. The whole investigation happens in one place.
Setting It Up in .NET
OpenTelemetry is the standard and .NET has first-class support for it. Add the packages:
dotnet add package OpenTelemetry.Extensions.Hosting
dotnet add package OpenTelemetry.Instrumentation.AspNetCore
dotnet add package OpenTelemetry.Instrumentation.Http
dotnet add package OpenTelemetry.Exporter.OpenTelemetryProtocol
Then configure it in your startup:
builder.Services.AddOpenTelemetry()
    .WithTracing(tracing => tracing
        .SetResourceBuilder(ResourceBuilder.CreateDefault()
            .AddService("my-api"))
        .AddAspNetCoreInstrumentation()
        .AddHttpClientInstrumentation()
        .AddOtlpExporter(opts => {
            opts.Endpoint = new Uri("http://tempo:4317");
        }));
That is it for the basics. ASP.NET Core instrumentation automatically creates spans for every incoming request. HTTP client instrumentation creates child spans for every outgoing call. You get the full request flow without writing a single manual span.
For database calls, add the relevant instrumentation package for your ORM. Entity Framework Core has one. SqlClient has one. They slot into the same setup.
Reading Traces in Grafana
Add Tempo as a data source in Grafana, point it at your Tempo instance, and you can start searching traces immediately. Filter by service name, duration, status, or any attribute your application adds to spans.
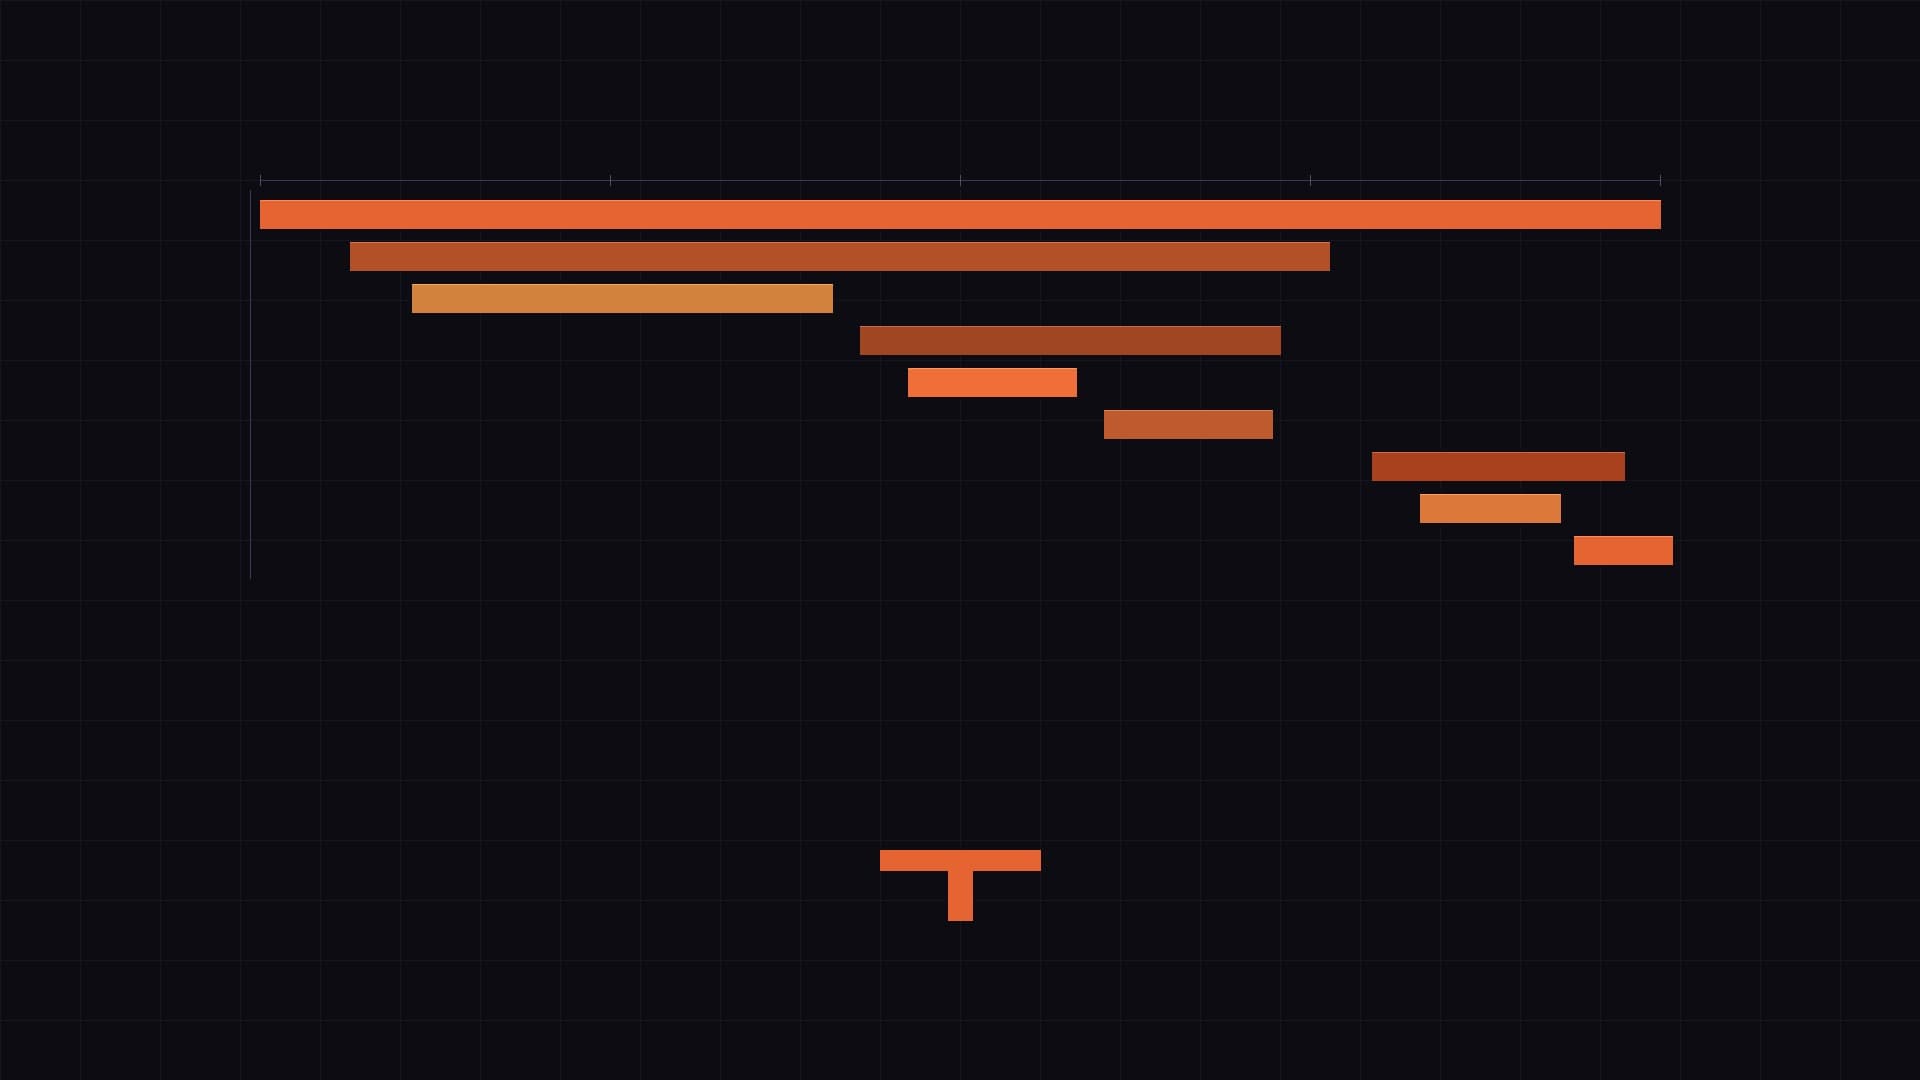
The waterfall view is where tracing becomes viscerally useful. You see every span laid out on a timeline, indented by parent-child relationship. A slow database query sits visually inside the handler that triggered it. A retry to an external service shows up as two consecutive spans with a gap between them. The shape of the trace tells you the story of the request.
Grafana also links Tempo to Loki automatically if you configure both. From a span, you can jump directly to the logs emitted during that span's time window, for that service, without any manual filtering. Correlation that used to require copy-pasting timestamps across three tabs is now one click.
What I Did Not Expect
I expected tracing to be useful for debugging slow requests. It is. But what surprised me was how useful it is for understanding the system's normal behaviour.
Looking at healthy traces — requests that completed fast and without errors — taught me things about the codebase I did not know. Database queries I thought were simple turned out to involve multiple round trips. A cache I assumed was being hit was actually missing on the first request of every session. You learn what your system actually does, not what you think it does.
That kind of understanding is hard to get from metrics and logs alone. Metrics aggregate everything. Logs capture specific events. Traces show you the structure of execution. All three together give you a complete picture.
Completing the Stack
With Prometheus, Loki, Tempo, and Grafana, the observability stack is complete. Metrics for the what, logs for the what exactly, traces for the why and where. All open source, all vendor-neutral, all connected in Grafana.
I set this up incrementally over several months, starting with Prometheus, then adding Loki, then Tempo. Each one added a layer of understanding that the previous ones could not provide. None of them required significant infrastructure investment or lock-in to a cloud provider's billing model.
If you have already come this far with Prometheus and Loki, Tempo is a natural and worthwhile last step.